Reporting and Analytics is an innovative group of Business Intelligence (BI) products...
making available static and interactive reporting, report server, and data analysis capabilities. The server provides comprehensive public interfaces making seamless integration with other applications possible and enhancing the ability to effortlessly add custom functionality.
Centralize Reporting and Analytics
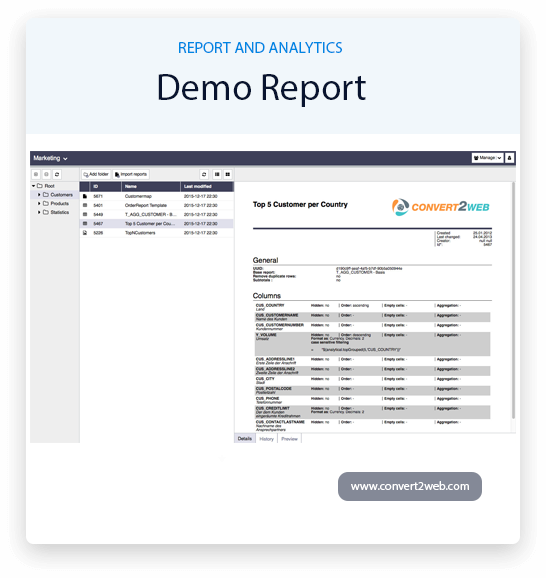
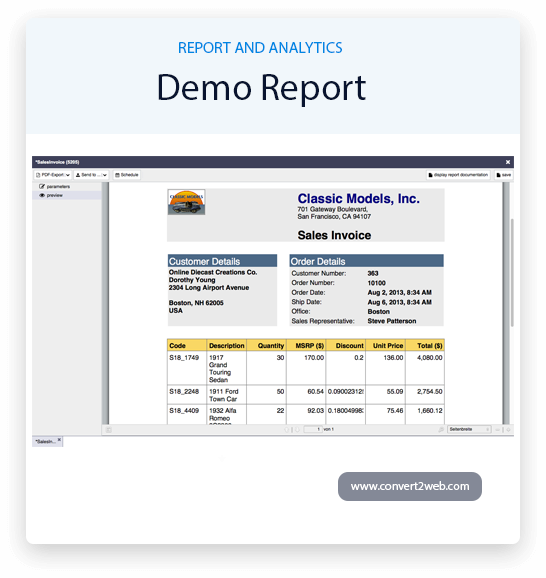
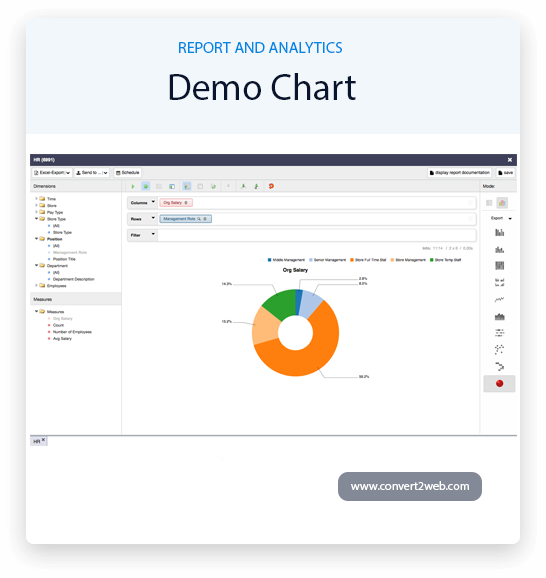
Conver2Web gives you the opportunity to create sophisticated layouts containing charts, images, sub reports, crosstabs, and many more. You can get access to your data through a wide number of sources including XML, Hibernate, Big Data (such as Hive), CSV, XML/A, and custom sources, after which you can publish your reports in PDF, RTF, XML, XLS, CSV, HTML, XHTML, text, DOCX, or OpenOffice formats.
Report is dependent on all the primary elements made available in the Reports library:
Line
Rectangle
Ellipse
Static Text
Text Field
Image
Frame
Sub Report
Crosstab
Chart
The core of the Report and Analytics is the server which gives you the capability to:
- Effortlessly create new reports based on views designed in an intuitive, web-based, drag and drop Ad Hoc Editor. (While the Ad Hoc Editor allows users to create simple reports, additional complex reports can be created outside of the server by using the Report Studio.)
- Efficiently and securely manage multiple reports.
- Relate with reports, including sorting, changing formatting, entering parameters, and drilling on data.
- Timeline reports for distribution through email and storage in the archive.
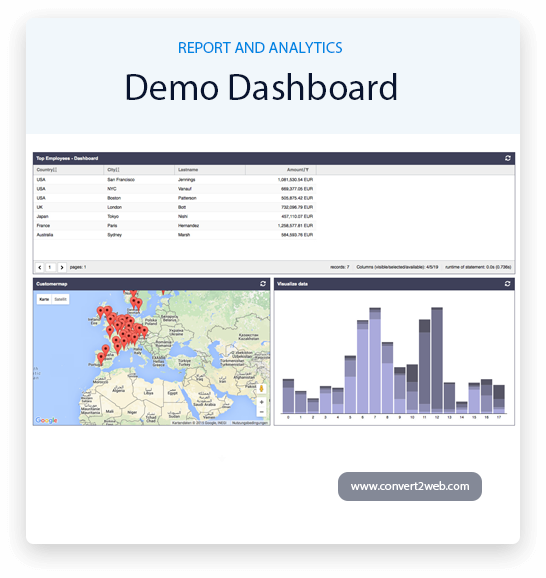
- Organize reports and web content to create attractive, data-rich Dashboards that effectively convey business trends.
Business Intelligence
Business Intelligence (BI) defines the capacity to jointly analyze all of a company's data, sorting relevant information to be used to enable effective business decisions. Accurate preprocessing of existing data, for example, in a data warehouse is the foundation of any BI solution. Convert2Web will gather your data, enabling users to efficiently get access to and analyze the available data. From ready evaluations to fine-tuned ad-hoc reporting; the tools to support your daily work are provided by reporting.
Data sources
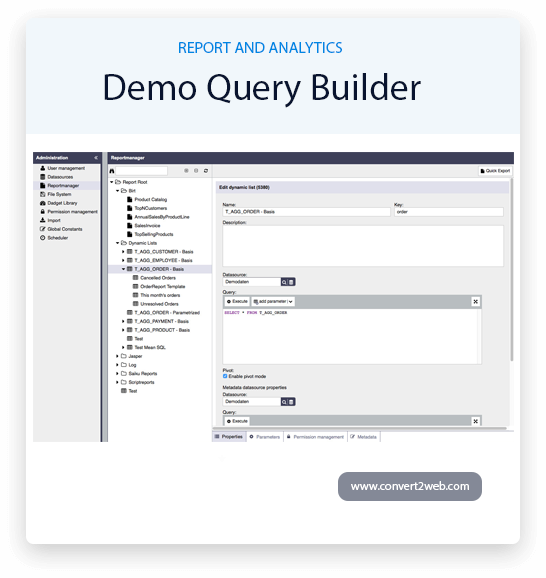
The primary prerequisite for running reports is the configuration of a data source. Like many other objects, resources are organized hierarchically in a tree structure. The hierarchic structure is a gateway that makes you able to retain the overview even when dealing with an enormous number of objects. Additionally, the hierarchic structure allows you to map even the most complicated access rules in a comprehensible manner.
File System
First and foremost, it serves to organize various files and resources so as to use them, for example, as a foundation for data sources (e.g. CSV files), or as resources for reports (e.g. images).
File: Any file (e.g. image, text file, CSV, etc.)
Relational databases
Accessing common relational databases via the data source type "Relational databases" is feasible. At present, the following SQL dialects are supported:
- DB2
- H2
- HSQL
- Informix
- MSSQL
- MySQL
- PostgreSQL
- Oracle
- Dynamic Lists
- Powerful Filters
- Aggregation
- Column Formats
- Templates
- Computed Attributes
- Self-Service Pivot
- Access Control, Security and Permissions
- ACLs and ACEs
- User Groups
- User Variables
- Authentication
- Scheduling
- And many more ...
- Effective tool for the ad-hoc generation of list-like reports
- Various output formats from Microsoft Excel over PDF to XML is allowed
- Features Audit-proof documentation
- Store your analysis as a report variant
- Configure filters per property
- Inclusion-, exclusion- and range filters
- Dynamic assortments via wildcards and a date-API
- Create arbitrarily nested filters with AND- and OR expressions
- Intra-column comparisons
Configure the display format per attribute
After exporting the report (e.g., to Excel), the display format (e.g., currency, number, date) can be configured per attribute which makes manual adjustments unnecessary.
Using templates, data from a dynamic list can be loaded directly into a prepared office document (Microsoft Excel or Word) or into an XML or text format.
- Supports Microsoft Excel templates
- Supports Microsoft Word templates
- Creates arbitrary XML dialects
- Generates custom text documents
Make full use of the functionality of your database for simple or complex computations.
Make new attributes via simple (or complex) computations
- Create complex crosstabs
- Use various chart types to visualize your data
In a manageable way, Report and Analytics is ready to be employed in large companies and display even complex authorization schemes. All objects are stored in hierarchical structures. This enables you to efficiently assign rights for whole sub trees.
The standards of ACLs and ACEs are followed in the authorization. Any object that needs to be saved has a list of permission entries. The permission entries control the access to the object itself as well as to all its sub objects. This enables you to comprehensibly and efficiently organize authorization even in enormous structures.
It is possible to define user groups, to create authorizations that do not result from the user's place in the tree, in these groups, single users, folders and entire sub trees can be subsumed and authorized. Therefore, even access privileges that break the hierarchy can easily be applied. User Variables
Specific variables are taken up my user roles in the server. They enhance a line-by-line authorization solution right up to the reports. The value of a user variable is determined by the user’s position in the hierarchy. The inheritance mechanism simplifies the management complexity. The value of the user variables can now be requested meanwhile of a report generation and may be used to limit the returned data.
You are running a Microsoft Active Directory, or want to integrate into a Single-Sign-On solution? We are ready to work within your IT-infrastructure. Report is multipurpose and allows you to touch into its authentication process to extend it via scripts or to even replace it completely with your preferred solution.
The embedded time management allows you to schedule your reports in server and distribute them automatically, e.g., via email. This is also applicable for complex date patterns.
Explain necessary conditions for a programmed execution. For example, you can tell server to not send out certain reports if they would contain no information.
- Powerful Parameters
- Entity Versioning
- Import / Export
- Many Supported Data sources
- Dynamic Script-based Data sources
- Global Parameters
- Easy Integrations
- Report Configuration via URL
- Interactive Reports
- A Terminal for Administrators
- Monitoring via JMX